


SEJournal Online is the digital news magazine of the Society of Environmental Journalists. Learn more about SEJournal Online, including submission, subscription and advertising information.
November 4, 2020

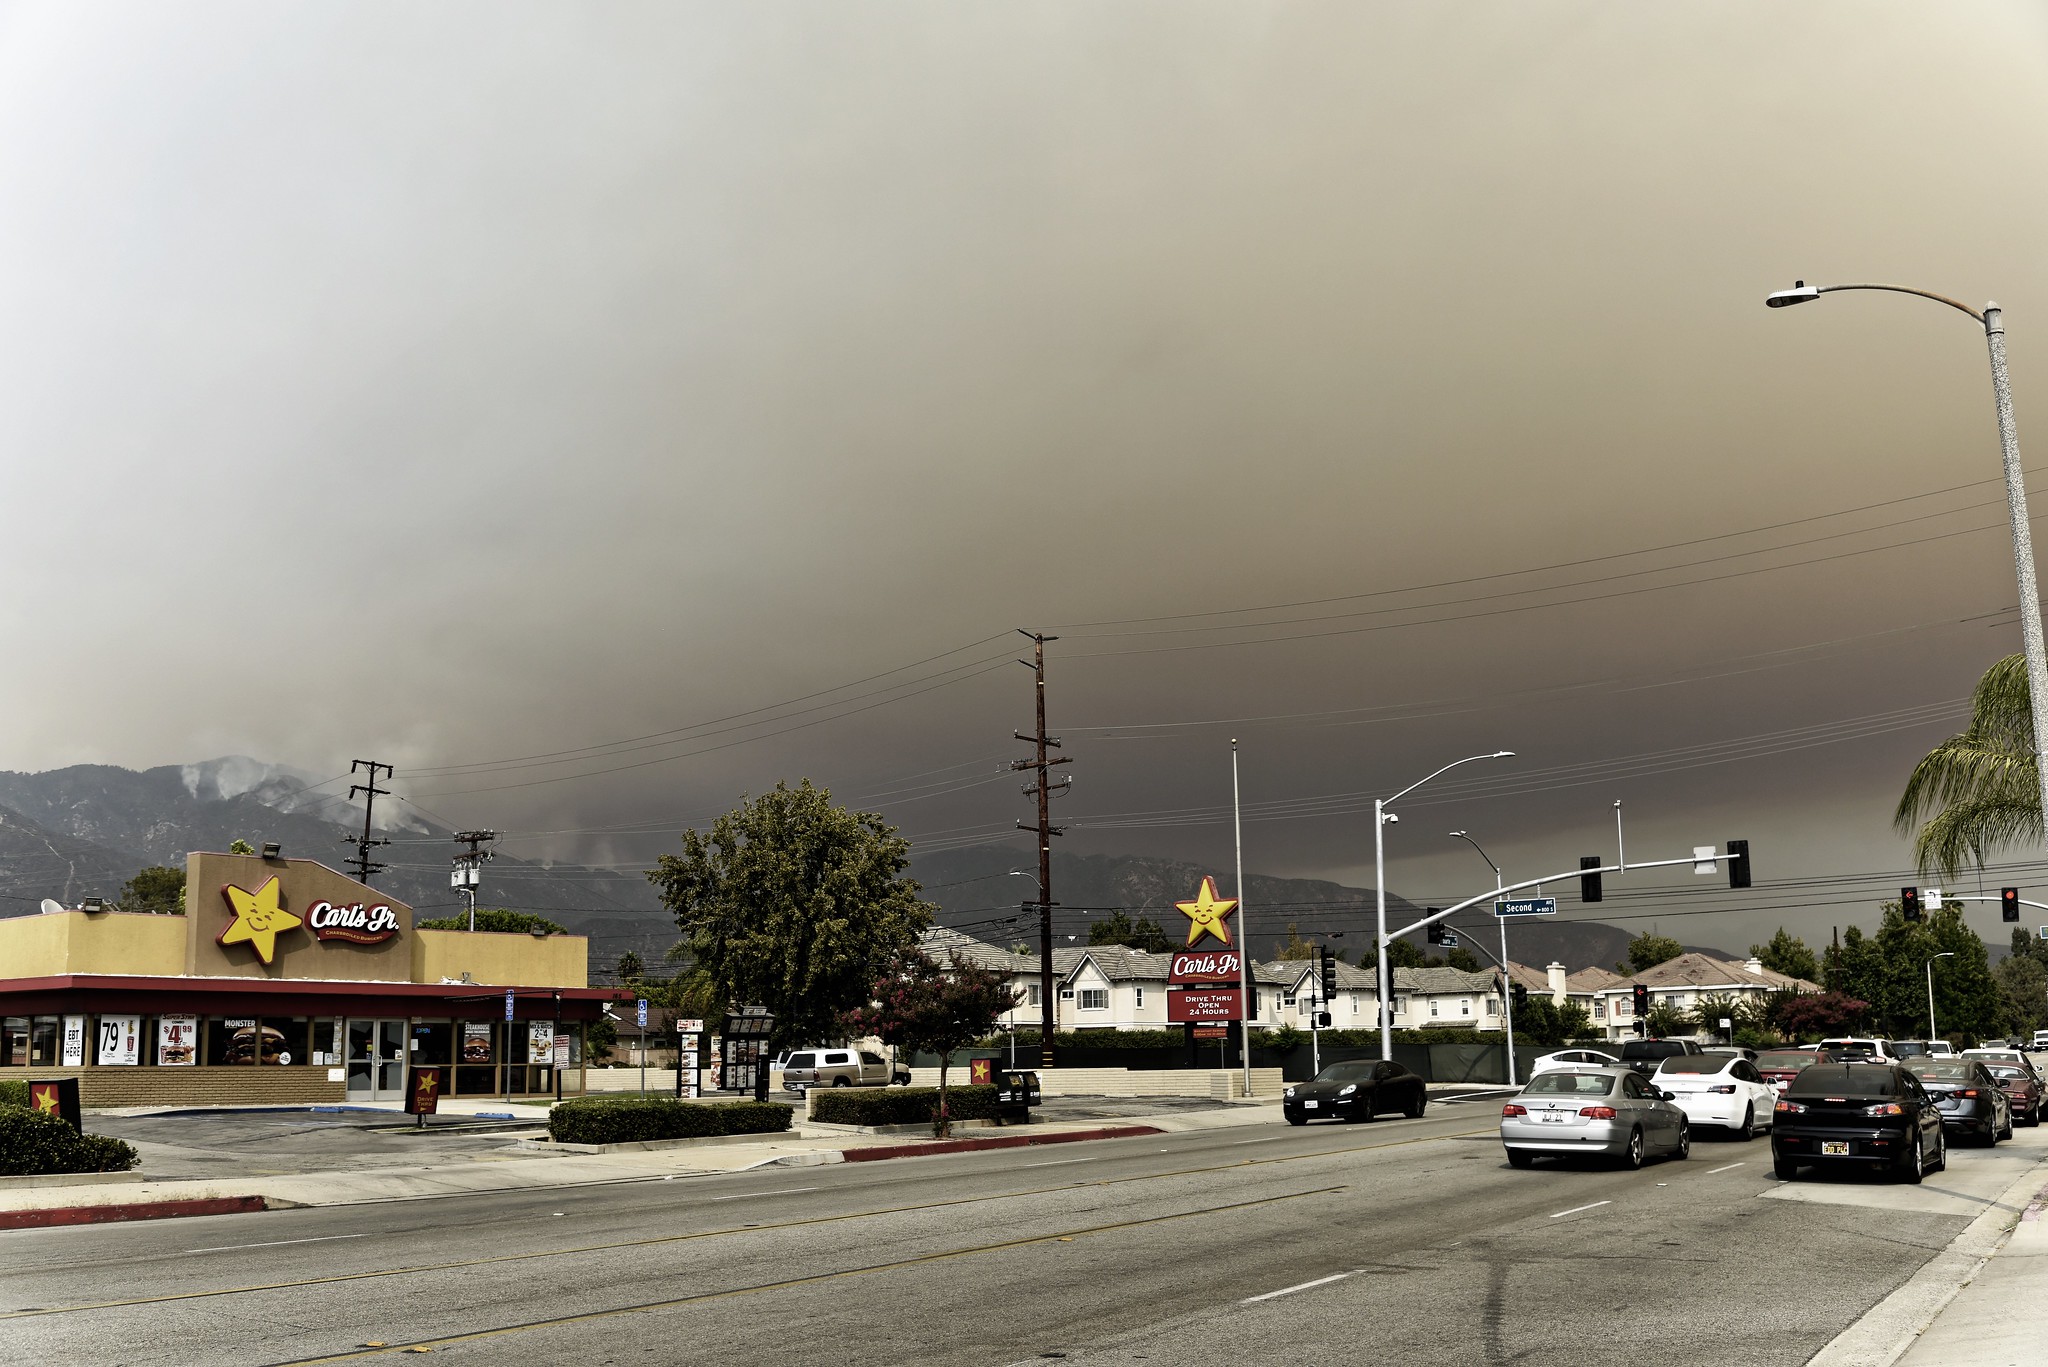 |
| Smoke from the Bobcat Fire in Angeles National Forest, near Monrovia, Calif., September 2020. Photo: Person-with-No Name, courtesy Flickr Creative Commons. Click to enlarge. |
Reporter’s Toolbox: Tracking Respiratory Health Risks From Wildfire Smoke
By Joseph A. Davis
In September, a lot of people headed to the emergency room with respiratory crises, not from the novel coronavirus, but from the climate change-driven wildfires turning Western skies orange. For environment journalists, that means it’s time for some health-related data reporting.
For an example of how data reporting on such smoke pollution can be done, the Associated Press has shown the way once again. Start by looking at the AP story of Oct. 15, by Matthew Brown and Camille Fassett. It’s model data reporting because the data isn’t the main thing. It’s about people and context. And story.
They analyzed data, but more importantly they interviewed researchers, doctors, health authorities — and emergency room patients lucky to be alive after wildfire smoke blanketed the region.
So if you want to steal their ideas, you can … and should. But the good news is there’s no thievery needed, since the data’s available to you too, to make it into stories, no matter how big or small the media outlet you work for.
Where the data comes from
To do their reporting, AP looked at data from a U.S. Environmental Protection Agency-centered database of readings provided by a large national network of air quality monitors. It is online, and downloadable (more specifically from here). It is a huge and handy resource for environmental journalists, and not just on smoke stories.
Air quality monitors are operated by EPA, state air agencies, local governments and tribes. EPA collects data from sources in all 50 states, Puerto Rico and the U.S. Virgin Islands. There are more than 4,000 monitoring stations in the network.
Over the decades, the air quality monitoring database
has sometimes gotten disorganized and messy,
but right now it seems in fairly good shape.
Over the decades, the air quality monitoring database has sometimes gotten disorganized and messy, but right now it seems in fairly good shape. It is accessible and you can download data if you want to crunch it yourself. It is also well documented (which means there is a lot to read).
Various monitoring stations have different purposes, but EPA and partners have standardized formats. The general name for the network is the Air Quality System, or AQS. Sometimes it is called the AirData website. The online searchable interface is called the AQS Data Mart. To use it, you have to register.
Another approach to some of the same data is through EPA’s Envirofacts Warehouse, specifically its ICIS-AIR Search interface.
How to use the data smartly
Key fact: The database tracks many important pollutants. They include carbon monoxide, ozone, nitrogen dioxide, sulfur dioxide, lead and particulate matter (10 and 2.5 micrometers).
That last one, PM 2.5 is the one that is the villain in wildfire smoke. Remember this when you are writing about air pollution from other sources.
Also, EPA may have put a monitor at the fenceline of a chemical plant to measure specific toxics.
One good thing about the data is how granular it is. You may be able to get a specific reading, for a specific hour, at a specific location.
Some of us are happier using EPA’s AirNow interface, because it presents the information via a map format. This is useful if, for example, you are tracking the development of regional smog on a summer day. But smoke writers will be happy to know it has a special set of maps for fire and smoke data.
If you are a data journalism maven, you may be able to use mapping tools to pursue your own particular inquiries. The AP smoke story, for example, overlaid a map of smoke readings with a map of Census data — giving a better idea of who, where and how people were being affected by smoke. One nice thing about the AQS is that it does include some demographic data.
[Editor’s Note: For more wildfire-related reporting ideas and headlines, check out SEJ’s Wildfire Issue page, including the TipSheet, “Where There’s Smoke, There's ... a Health Threat”. And watch soon for a TipSheet on wildfire insurance-related issues.]
Joseph A. Davis is a freelance writer/editor in Washington, D.C. who has been writing about the environment since 1976. He writes SEJournal Online's TipSheet, Reporter's Toolbox and Issue Backgrounder, as well as compiling SEJ's weekday news headlines service EJToday. Davis also directs SEJ's Freedom of Information Project and writes the WatchDog opinion column and WatchDog Alert.
* From the weekly news magazine SEJournal Online, Vol. 5, No. 40. Content from each new issue of SEJournal Online is available to the public via the SEJournal Online main page. Subscribe to the e-newsletter here. And see past issues of the SEJournal archived here.
SEJ Publication Types:
Topics on the Beat:
Visibility: