


SEJournal Online is the digital news magazine of the Society of Environmental Journalists. Learn more about SEJournal Online, including submission, subscription and advertising information.
August 8, 2018
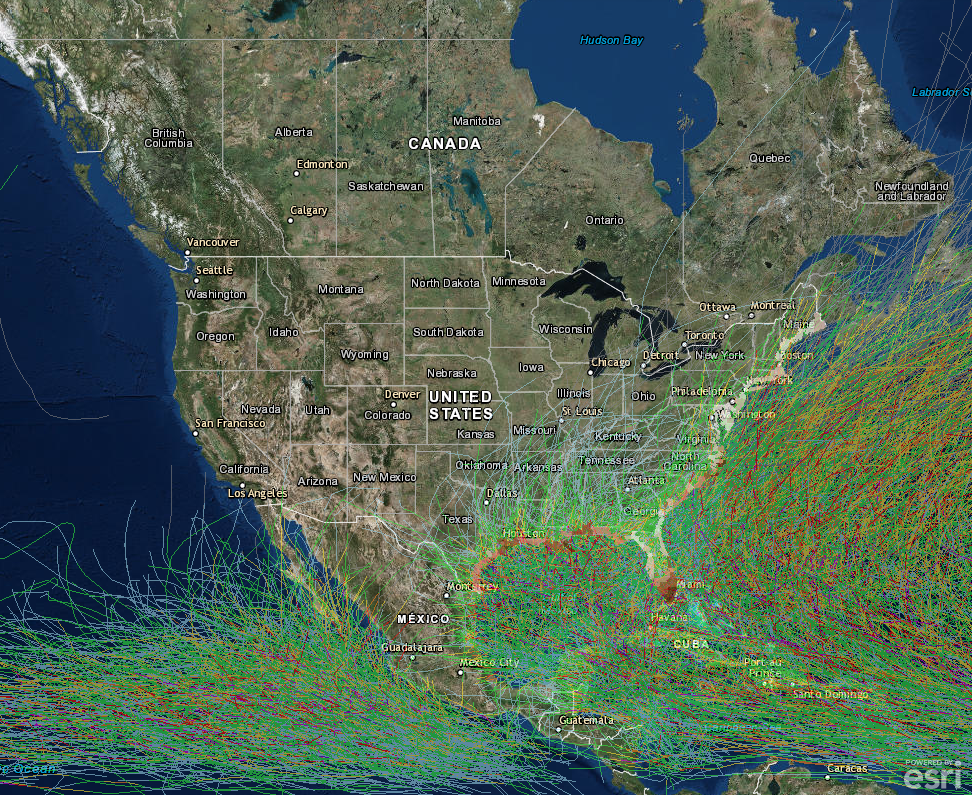 |
| A visualization of historical hurricane tracks. The path traced by a storm’s center is one good measure of its impacts. Image: National Oceanic and Atmospheric Administration. Click to enlarge. |
TipSheet: Hurricane Reporting, By the Numbers
If extreme weather is on your beat, it’s a good bet you’ll write about hurricanes — and soon. And when you do, consider doing it by the numbers. There will be plenty.

One such number is six, as in “Category 6.” Recently, news stories have speculated about the need to create the new category since hurricanes have, in recent decades, been getting stronger.
Newsfolk have long been content with the Saffir-Simpson scale, which today only goes up to Category 5 (wind speeds at or above 157 mph). The categories break in increments of roughly 12-20 mph in wind speed. So couldn’t winds above, say 180 mph (reached by Irma in 2017), call for a new category?
Such wind speeds are indeed possible. Some people say a higher category warning would carry more force. But professionals say Category 5 already foretells catastrophic destruction.
Experts predict that higher Atlantic sea-surface
temperatures resulting from climate change
will cause intensification of Atlantic hurricanes.
Wind speeds may get worse. But years of data, and platoons of hurricane experts, will be needed to confirm that. A lot of experts predict that higher Atlantic sea-surface temperatures resulting from climate change will cause intensification of Atlantic hurricanes.
By the way, when most of us say “hurricane,” we are talking in particular about a kind of storm called a tropical cyclone. These form over much of the world. In the Pacific, for instance, many tropical storms are called “typhoons.”
But the ones that emerge from near Africa in the equatorial Atlantic and spin through the Northern Atlantic, the Caribbean and the Gulf of Mexico, sometimes making landfall on the United States, are the ones the news media in common parlance call “hurricanes.”
Hurricane numbers of note
The wreckage and human trauma of the 2017 season should be enough to urge us to take the issue of wind speeds seriously. But 2017 reminded us of another important lesson: that Saffir-Simpson wind speed is not the only metric to watch in a hurricane. A prime example: It’s usually water from flooding and storm surge — something not predicted by Saffir-Simpson — that causes more harm than the actual wind.
Here are half a dozen other metrics to watch in your hurricane coverage:
- Central Pressure: A hurricane is essentially a convective vortex pulling hot, humid air off the sea surface in a self-renewing cycle: more heat, more energy, more spin, more wind. The center of the vortex is a low-pressure zone that pulls in the hot, humid air. The lower the pressure, the more intense the hurricane. The pressure is measured in millibars of mercury, a quaint term based on old-fashioned mercury barometers. Central pressure can range from 980 millibars for a Category 1 to 920 for a Category 5. It’s worth watching because a rapid drop in a hurricane’s central pressure is often associated with rapid intensification — a thing which has marked some of the deadliest storms in recent years.
- Width: The whirling arms of a tropical storm can extend many hundreds of miles beyond the core storm, where you find the most damaging winds. The widths (diameters) of storms vary a lot. Superstorm Sandy in 2012 had a very large width, which is one reason why it did so much damage, an estimated $70 billion worth.
- Track: The “track” of a hurricane is the predicted or actual path traced by its center, or eye, over sea and land. A storm’s track is a good measure of how badly it will impact land areas. The more it tracks over land, the worse its impact. When the National Hurricane Center starts issuing advisories on a storm, these will usually include probabilistic predictions of its track. Post-storm track visuals are also available. The National Oceanic and Atmospheric Administration, or NOAA, offers a visualization of some 150 years of hurricane tracks, which helps put things in perspective.
- Speed: You may be tempted to say “forward speed,” but don’t. Hurricanes often tend to bob and weave, dodge and feint, balk and stall. This wavering track makes predictions and warnings difficult. For instance, when a hurricane slows or stalls in its forward motion over an area, it often ends up dumping much more rain on the area. That was one key factor in Harvey’s unprecedented rainfall in the Houston area in 2017.
- Storm Surge: This is a sudden rise in sea levels near the point where a hurricane strikes land. It is caused by several mechanisms, but wind and atmospheric pressure are two big ones. Storm surge often causes catastrophic property damage and human casualties. It is also a compelling reason to heed evacuation orders. Storm surges may run from a few feet above high tide to extremes of 15-20 feet. NOAA offers maps of storm surge hazard areas. Pay attention to advisories from the National Hurricane Center and National Weather Service, or NWS, since these will include storm surge predictions.
- Rainfall: As hurricanes move inland, they drop the vast amounts of moisture that fuels them in the form of rain — and this rain keeps falling far inland long after their winds have lost hurricane force. Do not be fooled. Hurricanes kill more people with water than with wind. The devastation of the rains may be multiplied when a lot of water falls in a short time. Find your local NWS office and broadcast weather outlets, and monitor them for rainfall reports, hour by hour. Familiarize yourself with the system of stream gauges run by the U.S. Geological Survey.
* From the weekly news magazine SEJournal Online, Vol. 3, No. 29. Content from each new issue of SEJournal Online is available to the public via the SEJournal Online main page. Subscribe to the e-newsletter here. And see past issues of the SEJournal archived here.
SEJ Publication Types:
Topics on the Beat:
Region:
Visibility: